How marker-to-marker thickness is calculated
When you are finished making your selection on the Assign Data form, click Apply or OK to open the dedicated Thickness Map View. This will show:
- The selected area
- The wells that have the selected markers
- The thickness values of the anticipated thickness map, based on the selected markers.
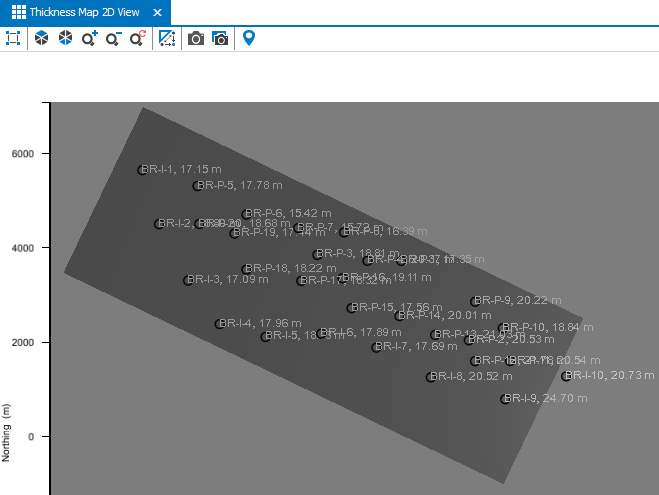
When using marker data only, completing the Assign Data step will show the anticipated area along with the well based thicknesses in the dedicated view. click to enlarge
The well based thickness values are shown by projecting an 'average' thickness point location on the thickness map. The thickness points can also be located outside of the thickness map area, while still being honored when interpolating. If you intend to exclude a well-based thickness, you can do so on the Refine Selection form.
The example below shows a schematic representation on how the final thickness values that you see on the map are determined. This example shows a simple case of two markers with '0' dip value.
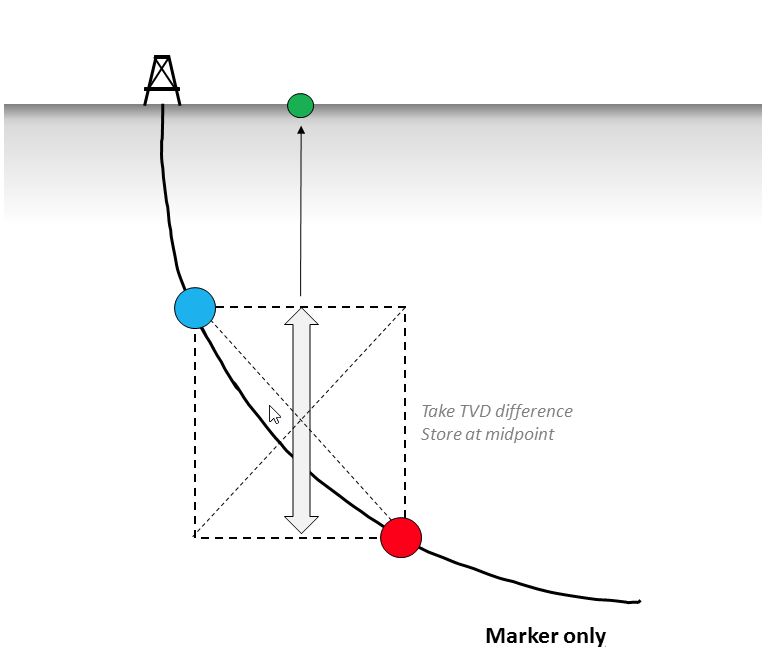
Schematic example of how the thickness values are shown on the thickness map as points (green dot). click to enlarge
An important distinction for the marker-to-marker calculation is whether the markers have a dip and azimuth property available in the JewelExplorer. Depending on that, the dip and azimuth information can be retrieved in two different ways:
- When the input markers do not have a dip or azimuth property, then the information is retrieved from the reference surface specified on the Assign Data form. A reference surface can be horizontal or dipping.
- When the input markers have a dip or azimuth property available in the JewelExplorer, then the property is used for the thickness calculation.
The schematic example below shows the marker-to-marker calculation for markers of a deviated wellbore in combination with a dipping formation. For more information on the marker-to-marker calculation, see the section TVT/TST Calculation in the Creating TVT/TST projections topic.
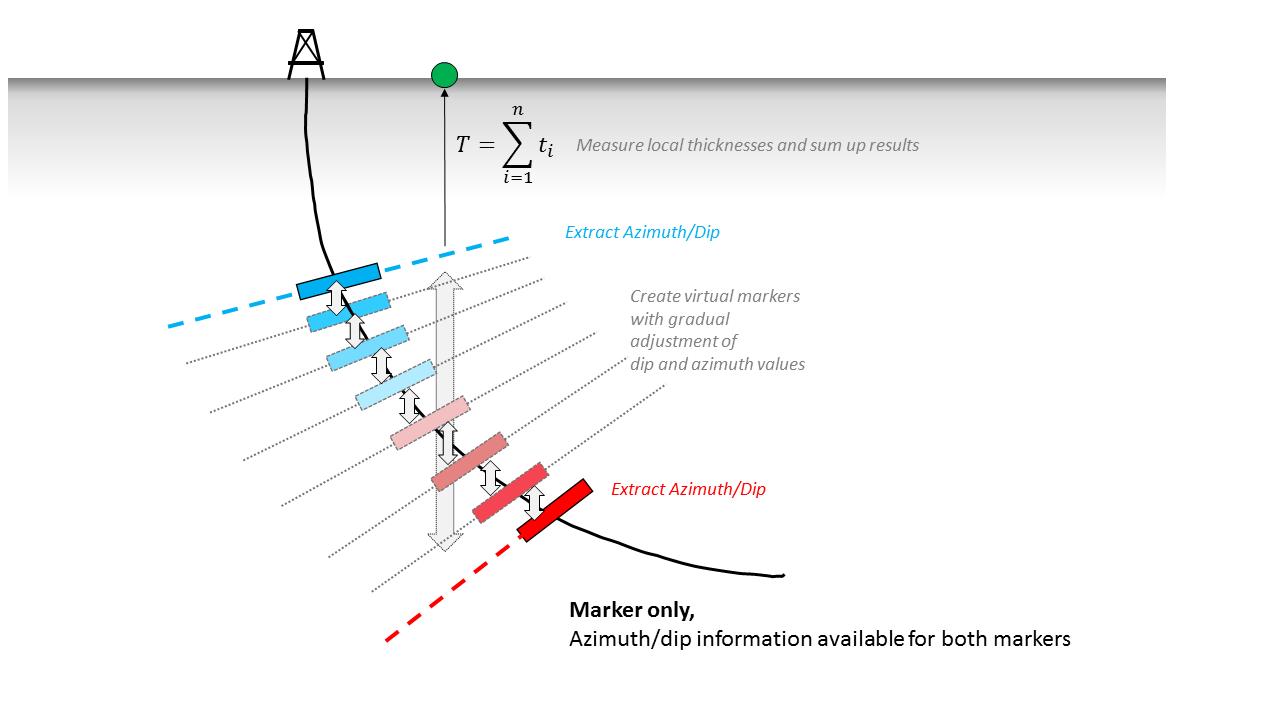
Image showing how the marker-to-marker thickness is calculated by dividing the space between the two markers into smaller intervals. The total thickness is the cumulative thickness of each interval. The thickness value is shown on the thickness map as thickness point (green dot). click to enlarge